
WAHOO SUGGESTED PAGES

We developed a comprehensive series of screens tailored for your Wahoo computer, designed to optimize your training experience. Each screen presents key information that will assist you in monitoring your performance metrics effectively.
These pages include real-time data on heart rate, power output, cadence, and speed, ensuring you stay informed throughout your sessions. By prioritizing the most relevant statistics, we aim to enhance your focus and facilitate goal achievement during each workout.
Whether you're in a structured training plan or engaging in casual rides, these screens will provide valuable insights to track your progress and make informed decisions about your training intensity and recovery.
CUSTOM PAGES - ORDER
We suggest ordering the pages to the following format. This allows for easy of use for both training, racing, ride reviewed DURING a workout, Strava integration, and much more. To move a page click “Edit” on the upper right of the application
WORKOUT DATA
LAP DATA
AVERAGE & MAXIMUM DATA
POWER DATA
PLANNED WORKOUT - Available when you have synced a workout, very useful when training!
SUMMIT SEGMENTS (STRAVA INTEGRATION - might require premium account)
HEART RATE ZONES - Visual graph and time in each HR zones (make sure to program your Wahoo Zones in the Application)
POWER ZONES - Visual graph and time in each Power zones (make sure to program your Wahoo Zones in the Application)
MAP

LAP DATA
This screen shows automatically when you press the Lap Button. Its super useful for racing, or structured training as it allows you to see specific metrics to only the lap segment.
AVG POWER - 3 SECOND COLOR - includes “color” zones
CURRENT SPEED (vs workout avg)
CADENCE
CURRENT LAP ACTIVE TIME - Show you the lap, helpful for timed races like 45 minutes, etc
DISTANCE (Lap) - Helpful for racing
AVG POWER (Lap) - Great for both intervals and racing, gives you exact information intensity of the effort
AVG SPEED (Lap) – Best for racing helps determine if the race is hard, easy, or if a breakaway is good/bad idea
POWER TO WEIGHT - Helpful insight for interval training
ALTERNATE = CALORIES BURN RATE - Super useful for longer rides or races to determine nutrition needs
CURRENT GEAR (Visual) - Requires Di2 integration
ALTERNATE DATA
Don’t have Di2 or Power Meter? Try these as alternate options:
LAP NUMBER - great to show you which interval you may be on
MAX SPEED (Lap)
KILOJOULES (Lap) - Good for nutrition
ASCENT (Lap)
CALORIES BURN RATE - Super useful for longer rides or races to determine nutrition needs

WORKOUT DATA
This is your main page for 95% of training time on the bike! Its setup with maximum amount of data for nearly all use cases.
AVG POWER - 3 SECOND COLOR - includes “color” zones (make sure to program your zones in the Wahoo Application!)
CURRENT SPEED (vs workout avg)
CADENCE
ACTIVE TIME (ride time minus paused)
TIME OF DAY
HR ZONES - COLOR - (Make sure to program your zones in the Wahoo application
DISTANCE
TEMPERATURE
CURRENT GEAR (Visual) - Requires Di2 integration
ALTERNATE DATA
Don’t have Di2 or Power Meter? Try these as alternate options:
AVERAGE SPEED
MAX SPEED
KILOJOULES (Workout)
ASCENT - Feet climbed during ride

AVERAGE AND MAXIMUM
This screen provides insight on your efforts during the ride. It can be fun just to lookup the maximum power, or maximum speed!
NORMALIZED POWER
AVERAGE POWER (Workout)
MAX POWER (WORKOUT)
AVERAGE SPEED (Workout)
MAX SPEED (WORKOUT)
AVERAGE CADENCE (Workout)
MAX CADENCE (WORKOUT)
AVERAGE HEART RATE (Workout)
MAX HEART RATE (WORKOUT)

POWER DATA
Super helpful to give insight on our power performance metrics during a ride.
Leave this screen off, or use KJ, TSS, paused in other screen if you don’t have a power meter.
Kilojoules (WORKOUT)
TRAINING STRESS SCORE
MAX POWER (3 sec)
MAX POWER (1 min)
MAX POWER (5 min)
MAX POWER (20 min)
TORQUE (Workout)
PAUSED TIME (Workout)
ALTERNATE DATA
MAX POWER (60 min)
MAX POWER (Workout)

PLANNED WORKOUT
This screen allows for insight when doing a specific workout programmed by coach, yourself, etc and requires integration with a training program like Training Peaks, Todays Plan, etc
TARGET POWER - Super useful to provide insight for the effort range
AVG POWER (3 sec - zone color)
CADENCE
HEART RATE (Zone Color)
REMAINING TIME/DISTANCE (INTERVAL) - Also super helpful and frequently used with Target Power
INTERVAL COUNT - Can’t remember how many you have done? Perfect to help resolve where you are in the workout session.
REMAINING TIME/DISTANCE (WORKOUT) - Also provide insight into how much longer until completion of whole session which give you an idea of how hard/easy to gauge your efforts.
CURRENT SPEED (vs Average Workout - Nice to have speed during your intervals
ALTERNATE DATA
LAP NUMBER - great to show you which interval you may be on
MAX POWER (3 sec)
MAX POWER (1 min)
MAX POWER (5 min)
CALORIES BURN RATE - Super useful for longer rides or races to determine nutrition needs
POWER TO WEIGHT - Helpful insight for interval training

POWERZONES
This screen provides insight on your efforts during the ride by time and in graph format.
Below is based on an 8 zone system, adjust as needed and or add other data. Make sure to program zones in the application!
POWER ZONES GRAPH
POWER IN ZONE 1
POWER IN ZONE 2
POWER IN ZONE 3
POWER IN ZONE 4
POWER IN ZONE 5
POWER IN ZONE 6
POWER IN ZONE 7
POWER IN ZONE 8
ALTERNATE DATA
AVERAGE POWER (Workout)
MAX POWER (Workout)

HEART RATE ZONES
This screen provides insight on your efforts during the ride by time and in graph format. Make sure to do those zones in the application! No Need to wait until the ride is done or use online application to see your metrics! Now you can view them live.
HEART RATE ZONES GRAPH
HR TIME IN ZONE 1
HR TIME IN ZONE 2
HR TIME IN ZONE 3
HR TIME IN ZONE 4
HR TIME IN ZONE 5
CALORIES
CALORIES BURN RATE - Super useful for longer rides or races to determine nutrition needs
AVERAGE HEART RATE (Workout)
ALTERNATE DATA
MAX HEART RATE (WORKOUT)

STRAVA LIVE SEGMENTS
Fun way to gauge your personal efforts or compare against other riders. Best to keep this one simple as there is other default data on the screen.
AHEAD/BEHIND TIME
GOAL DURATION
DISTANCE REMAINING
ESTIMATED DURATION - One of the most important ones as it shows you how much longer to the end from current point
GRADE (Slope Background)
CURRENT SPEED
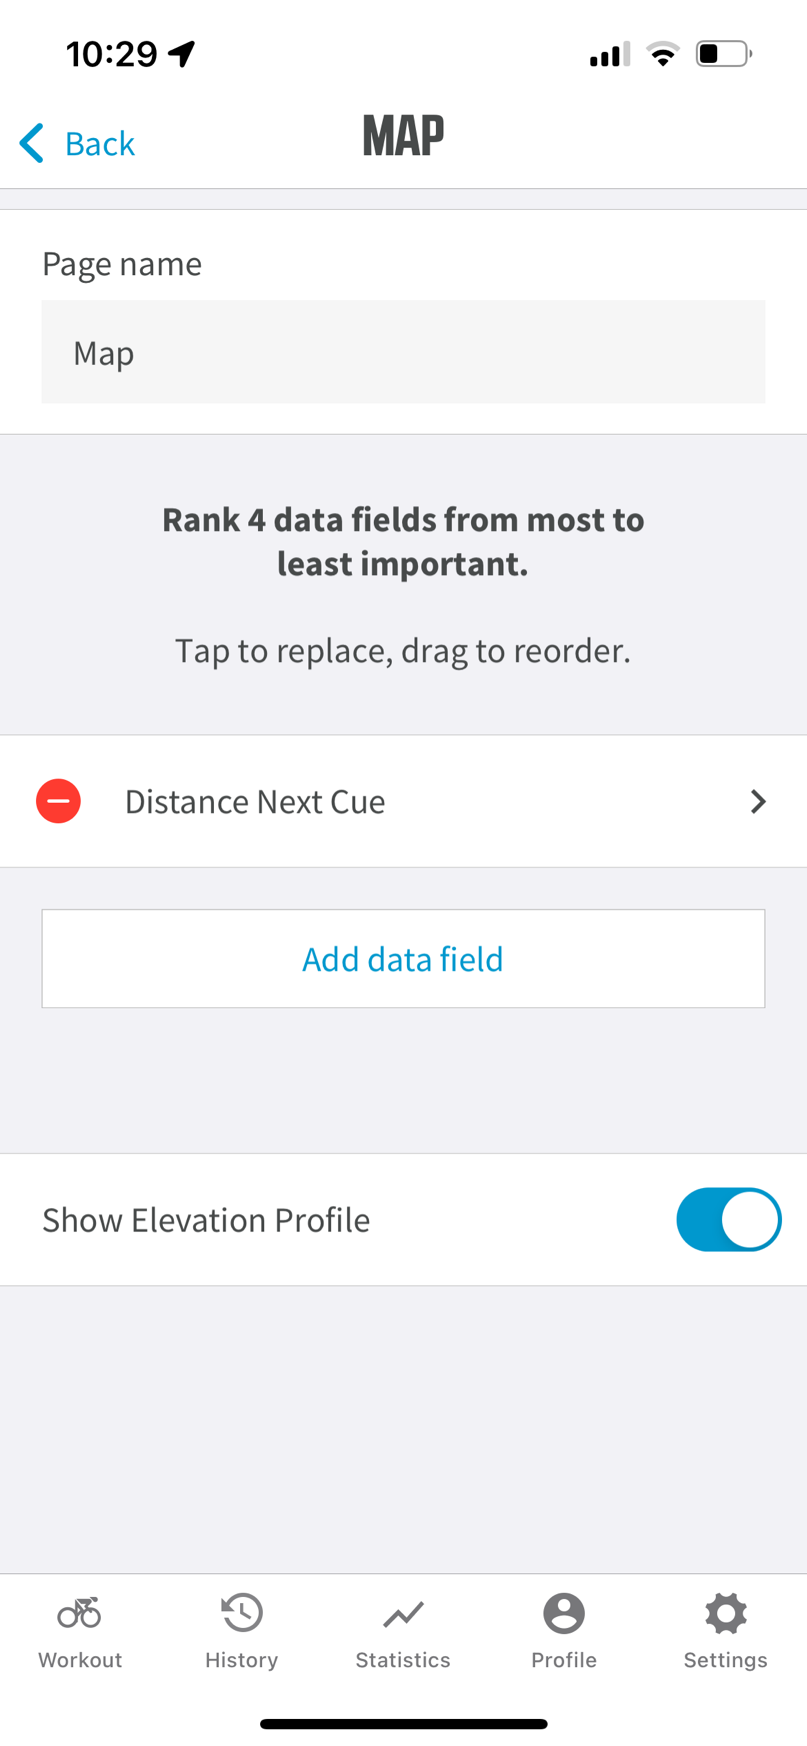
MAP
One of the least used screens, and it best left “simple” in format. Can also be turned off for those who ride the same courses daily/weekly, as it speeds up the cycling of screens when riding.
DISTANCE TO NEXT QUE
Only shown when during a planned course